Saturday, 18 December 2021

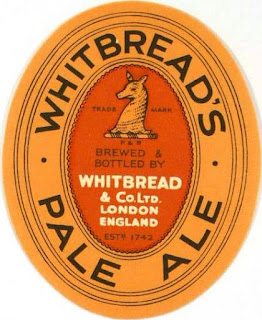
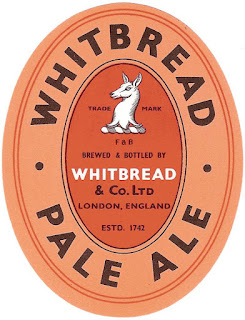
Let's Brew - 1909 Whitbread 2PA

I thought I may as well give you Whitbread's whole range of Pale Ales. No need to thank me, It's just my job.

Below PA in the strength hierarchy was the not very inspiringly named 2PA. Today, it would be about as strong as Bitter gets. Sadly, it wasn’t to be around for much longer. It was discontinued in 1916 and never reappeared.

It hadn’t been around all that long, only appearing in 1888, a good two decades after PA. It was brewed in far greater quantities, though: in 1909, 40,063 barrels to PA's 9,939 barrels. Making it far more likely for you to come across it down the pub.

Which has me wondering: was it a Stock Ale? Were I pushed, I’d go for it being semi-Stock, aged for maybe a couple of months after racking. The gravity just looks too high for it to be a running beer.

No need to mention anything about the recipe, it having been parti-gyled with the PA whose recipe I recently posted.


1909 Whitbread 2PA
pale malt 8.75 lb 79.55%
no. 1 sugar 2.25 lb 20.45%
Goldings 90 mins 1.50 oz
Goldings 60 mins 1.50 oz
Goldings 30 mins 1.50 oz
Goldings dry hops 0.50 oz
OG 1054.5
FG 1017
ABV 4.96
Apparent attenuation 68.81%
IBU 56
SRM 7
Mash at 151º F
Sparge at 165º F
Boil time 90 minutes
pitching temp 59º F
Yeast Wyeast 1099 Whitbread ale


Friday, 17 December 2021

Dutch Beer production by type 1938 - 1954

I know. More numbers. But some of them are just so juicy. How could I leave them on the vine?

One large change – which was either precipitated of accelerated by the war – was in the type of beer being produced and consumed.

Rather surprisingly, the most popular class of beer pre-war was Lagerbier. That is, either Pale or Dark Lager of 3.5% ABV. The equivalent of Pale or Dark Mild, these were the beers consumed in draught in the cafés of the large cities in the West of Holland: Amsterdam, Rotterdam and Den Haag. Heavy beer – the 5% ABV Pils and Münchener – sold in rather lower quantities, but was more popular in the provinces.

The other two classes were far less popular. Extra Heavy was Bokbier. As this was only available for a couple of months a year, it’s no surprise its sales were modest. Its high price doubtless played a role, too. The Intermediate class of beer was only produced by a limited number of breweries. As the name implies, it was halfway in strength between Lager and Heavy.

Sales of Lagerbier collapsed after the war, as did those of the Intermediate class. It’s quite likely that the rise of Pils was connected to rising living standards with drinkers upgrading to Pils. Something similar happened in the UK with a move from Mild to Bitter. Eventually, Lagerbier totally disappeared.

By 1950 Heavy Beer, which at that point was almost all Pils, claimed more than 80% of sales. It would only go on to consolidate its position as most popular style in the 1960s and 1970s, leaving Holland a virtual monoculture.

Bokbier – after an initial post-war burst of enthusiasm – settled back down to around 1% of the market. Perhaps drinkers had just been thrilled to get their hands on a properly strong beer again.


Dutch beer production by type 1938 - 1954 (hl)
Year Lager Intermediate Heavy Extra heavy Total
1938 663,650 30,303 565,189 10,214 1,269,336
1939 747,458 32,986 605,576 12,091 1,398,111
1946 668,838 18,077 1,090,303 12,188 1,789,406
1947 388,834 9,731 1,191,739 8,998 1,599,302
1948 257,986 7,915 1,020,550 23,499 1,309,950
1949 174,240 6,717 807,996 18,822 1,007,775
1950 166,471 6,894 880,865 14,232 1,068,462
1951 160,244 6,732 901,933 13,744 1,082,653
1952 161,328 4,592 945,166 13,423 1,124,509
1953 188,973 2,965 1,078,995 12,486 1,283,419
1954 198,588 1,789 1,195,980 14,139 1,410,496
Source:
De Nederlandse Brouwindustrie in Cijfers, by Dr. H. Hoelen, Centraal Brouwerij Kantoor, 1955, held at the Amsterdam City Archives, page 39.


Dutch beer production by type 1938 - 1954 (%)
Year Lager Intermediate Heavy Extra heavy
1938 52.28% 2.39% 44.53% 0.80%
1939 53.46% 2.36% 43.31% 0.86%
1946 37.38% 1.01% 60.93% 0.68%
1947 24.31% 0.61% 74.52% 0.56%
1948 19.69% 0.60% 77.91% 1.79%
1949 17.29% 0.67% 80.18% 1.87%
1950 15.58% 0.65% 82.44% 1.33%
1951 14.80% 0.62% 83.31% 1.27%
1952 14.35% 0.41% 84.05% 1.19%
1953 14.72% 0.23% 84.07% 0.97%
1954 14.08% 0.13% 84.79% 1.00%
Source:
De Nederlandse Brouwindustrie in Cijfers, by Dr. H. Hoelen, Centraal Brouwerij Kantoor, 1955, held at the Amsterdam City Archives, page 39.


Thursday, 16 December 2021

Beer consumption per capita 1937 - 1954

As well as lots of lovely Dutch numbers, the archive document also fills in some gaps in general European statistics. Like beer consumption.

I can't recall ever seeing numbers which cover this period. The ones I have only cover from the 1970s onwards, This set shows quite a different picture to the later one.

No shock that Belgium is up there at the top. Nor that the UK was quite high. The big shocker is Ireland, which in the last few decades has always been in the top ten. Shocking to think that they used to rank below Sweden and Switzerland.

Interesting to see that Holland and the UK were the only countries to see a significant increase in consumption during the war years. Especially when compared to the three neutral countries in the tablem Ireland, Sweden and Switzerland.

Beer consumption per capita 1937 - 1954
Year Belgium Luxemburg UK Denmark Ireland Sweden Switzerland Germany Holland
1937 171 126 86 57 36 43 51 64  
1938 168 132 86 58 33 45 51 70 25.3
1939 155 115 89 59 36 46 52 — 27.4
1940 — 87 88 48 36 40 59 — 33.4
1941 71 — 100 54 34 35 47 — 43.2
1942 62 — 101 50 33 32 33 — 39.1
1945 59 — 102 56 32 35 24 — 42.6
1944 58 — 107 62 42 45 20 — 34.2
1945 94 22 110 51 43 37 24 — 21.2
1946 129 71 104 65 48 38 27 — 32.0
1947 148 75 100 68 48 41 37 38 28.3
1948 155 67 94 71 40 40 37 22 22.9
1949 125 77 88 75 51 39 41 29 17.4
1950 118 87 82 72 49 38 42 37 18.2
1951 115 — 82 67 50 37 44 47 18.3
1952 118 — 82 65 54 38 49.7 52 18.9
1953 120 98 85 70 — 38.7 49.9 56.8 21.4
1954 120   81.8 70       58.9 23.5
Source:
De Nederlandse Brouwindustrie in Cijfers, by Dr. H. Hoelen, Centraal Brouwerij Kantoor, 1955, held at the Amsterdam City Archives, pages 51 and 55.

Wednesday, 15 December 2021

Let's Brew Wednesday - 1909 Whitbread PA

Here we are just before the great cataclysm of WW I. And Whitbread’s flagship Pale Ale is as muscular as ever, even a bit stronger than in 1881.

The grist is near identical 80% base malt, 20% sugar. Though in this later version, the malt is split between 25% pale malt (made from Smyrna barley) and 75% of the classier PA malt. As usual. Whitbread couldn’t be arsed to record the type of sugar, leaving me to guess No. 1 invert.

One major change, which isn’t immediately apparent is a lowering of the hopping rate. Down from 15 lbs per quarter (336 lbs) of malt to just 9 lbs. Unsurprisingly, this has a considerable impact on the calculated bitterness level, dropping from 94 IBU to 61.5 IBU. Three types of East Kent hops from the 1908 season graced the copper. Goldings seems a fair enough guess as to the variety.

As this was probably still a Stock Ale, aged for many months, the true FG would have been considerably lower than the racking gravity listed in the table.

1909 Whitbread PA
pale malt 10.25 lb 80.39%
no. 1 sugar 2.50 lb 19.61%
Goldings 90 mins 1.75 oz
Goldings 60 mins 1.75 oz
Goldings 30 mins 1.75 oz
Goldings dry hops 0.50 oz
OG 1062.7
FG 1019
ABV 5.78
Apparent attenuation 69.70%
IBU 61.5
SRM 8
Mash at 151º F
Sparge at 165º F
Boil time 105 minutes
pitching temp 59º F
Yeast Wyeast 1099 Whitbread ale


Tuesday, 14 December 2021

It's that time of year again

Almost. Time to prepare your eggs and string as it's almost time for Drinkalongathon.

This year there's a twist - its going to be exactly the same as every other year. What could be more different and exciting than that?

More instructions will follow. But do prepare your string early in this pandemic year. You wouldn't want to wake up on the day and realise that you have no string. What a disaster that would be? Though obviously not as bad as finding yourself Islay-less.

I'm guessing I'll have to buy my own whisky again.

Not more Dutch numbers

Fancy some more Dutch beer statistics? I thought not. Bugger you, that's what you're getting. The title is just a blatant lie. Or as I prefer to put it, my own personal interpretation of the truth. Everyone is at that sort of crap nowadays, why shouldn't I join in. The truth has become a rather tenuous concept.

Just a load of numbers today. Because I'm lazy and have other things to be getting on with. Don't expect a huge amount of analysis.

Here's the absolute minimum. The consumption of all alcoholic drinks fell over the period covered. Beer by 58%, wine by 62% and spirits by a massive 75%. Though Dutch consumption of spirits was very high in the 19th century. Almost 10 litres per head is a shitload.

While spirits consumption was already in sharp decline in the Edwardian period, it was WW I which really put a dent in the beer numbers. The reason was quite simple: they ran out of malting barley and simply couldn't brew any more beer than they did. Beer, at least until 1954, never fully recovered.

Except, these number stop before the big turnaround as Dutch drinkers regained their love of beer. Its popularity rose in the following decades,with consumption peaking at 88 litres per capita in 1988.

Dutch consumption of alcoholic drinks 1875 - 1854
year beer spirits wine
1875 33.3 9.37 2.45
1880 33.8 9.80 2.57
1885 33.7 9.16 2.20
1890 36.4 8.91 2.05
1895 39.6 8.68 1.90
1900 42.0 8.23 2.16
1905 40.4 7.42 1.82
1910 35.8 5.21 1.63
1914 37.9 5.55 1.05
1915 37.9 4.51 1.00
1916 36.9 4.75 1.50
1917   4.98 0.46
1918 10.0 3.23 0.38
1919 13.0 4.25 2.43
1920 17.5 5.16 1.59
1921 23.0 2.90 1.69
1922 24.6 2.81 2.02
1923 26.0 2.36 1.36
1924 25.1 2.21 1.68
1925 25.2 2.11 1.98
1926 25.8 2.03 2.12
1927 25.4 1.99 1.85
1928 27.8 1.91 1.83
1929 28.0 2.39 1.84
1930 27.5 2.54 1.71
1931 25.3 2.31 1.45
1932 21.6 1.97 1.13
1933 19.0 1.82 0.90
1934 17.5 1.61 0.91
1935 15.3 1.49 0.93
1936 14.0 1.44 1.05
1937 14.1 1.45 1.20
1938 14.9 1.46 1.14
1939 15.2 1.57 1.31
1946 19.1 1.27 0.54
1947 16.9 2.33 0.77
1948 13.6 3.18 1.09
1949 10.4 3.20 0.54
1950 10.9 2.95 0.50
1951 10.9 2.67 0.62
1952 11.3 2.23 0.51
1953 12.7 2.15 0.65
1954 13.9 2.31 0.92
Source:
De Nederlandse Brouwindustrie in Cijfers, by Dr. H. Hoelen, Centraal Brouwerij Kantoor, 1955, held at the Amsterdam City Archives, pages 52 - 53.


Monday, 13 December 2021

Dutch beer consumption 1938 - 1954

I did warn you. Loads more numbers related to the Dutch brewing industry.

I can't help myself. When I come across such lovely plump. ripe numbers, I can't help but harvest them. It's a sickness.

Consumption per capita, which increased greatly during the war, fell back to below the pre-war level once the nastiness was over.

You may be asking yourselves: how is this possible when beer production was higher than in 1939? It’s because Holland was exporting considerable quantities of beer. By the 1950s, around 30% of total output. This offset Dutch drinkers falling out of love with beer.

Exports were far greater, both in absolute terms and in as a percentage of output after the war. Holland quickly transformed itself into one of the world’s major beer exporters. By 1950, it had gained the no. 1 spot.  A position it still held in the early 2000s.  

Dutch per capita beer consumption (litres)
year total population 18-65 year olds consumption
1938 8,684,082 5,119,701 25.30
1939 8,781,273 5,200,407 27.36
1940 8,878,611 5,278,522 33.42
1941 8,965,484 5,349,754 43.21
1942 9,041,986 5,410,625 39.11
1943 9,102,410 5,446,574 42.61
1944 9,174,432 5,476,661 34.20
1945 9,262,298 5,523,879 21.24
1946 9,423,480 5,595,678 31.98
1947 9,629,275 5,668,764 28.27
1948 9,800,155 5,739,485 22.85
1949 9,955,594 5,812,519 17.36
1950 10,115,527 5,886,761 18.17
1951 10,264,511 5,953,960 18.26
1952 10,581,987 5,995,624 18.91
1953 10,455,651 6,050,000 21.41
1954 10,550,737 6,100,000 23.50
Source:
De Nederlandse Brouwindustrie in Cijfers, by Dr. H. Hoelen, Centraal Brouwerij Kantoor, 1955, held at the Amsterdam City Archives, page 51.

Sunday, 12 December 2021

Dutch beer production 1930 - 1954

You're going to have to get used to these tables of Dutch statistics. There are going to be an awful lot more of them. No way I'm wasting the work I've spent harvesting them.

Overall, beer production held up surprisingly well, with the quantity in 1944 well above that of 1939. The numbers after 1940 are, however deceptive. Big cuts in gravity meant that in terms of º Plato hl, it was in reality well down. The majority of the beer produced in 1945 was after the liberation of Holland.

This is in contrast to the UK, where despite wartime restrictions, both the bulk quantity produced and degrees SG barrels increased. The latter can be observed by looking at the number of “standard” barrels – 36 gallons with an OG of 1055º. In 1939 18,364,156 standard barrels were brewed and in 1945 19,678,449. 

Surprisingly, at least some breweries continued to brew through the Hongerwinter (“Hunger Winter”) of 1944/45. Amstel in Amsterdam managed to produce a few thousand hectolitres each month January to April 1945.   Though this was far below their normal output level. By the end of the year the amount being brewed had shot up – 33,190 hl in December compared to 3,499 hl in January.

Despite this bounce back, total Dutch beer production in 1954 remained below that of 1930.


Dutch beer production 1930 - 1954
Year hl Year hl
1930 2,280,000 1943 2,265,552
1931 2,105,000 1944 1,848,541
1932 1,807,000 1945 1,175,497
1933 1,609,000 1946 1,882,908
1934 1,512,000 1947 1,854,157
1935 1,575,000 1948 1,558,086
1936 1,262,000 1949 1,519,515
1937 1,298,000 1950 1,428,546
1938 1,580,868 1951 1,605,295
1939 1,508,591 1952 1,611,204
1940 1,757,978 1953 1,852,201
1941 2,247,191 1954 1,982,055
1942 2,076,092    
Source:
De Nederlandse Brouwindustrie in Cijfers, by Dr. H. Hoelen, Centraal Brouwerij Kantoor, 1955, page 17, held at the Amsterdam City Archives.