One of the big successes of the war – and the reason beer didn’t suffer as badly as in WW I, despite an even more intense German U-Boat campaign – was the huge increase in barley production. But by 1952 the situation was improving and controls were starting to be relaxed. Like by removing price controls:
“BARLEY AND MALT
The Government announced on January 21st that controls on prices and supplies of cereals and feeding-stuffs will be ended at the next harvest; while the subsidy on feeding-stuffs should be withdrawn on April 1st. Farmers will have the same specific price assurances for 1953 and 1954 as now, under the Agricultural Act, but it is anticipated that feeding grain prices are likely to rise a little, possibly £2 or £3 a ton, when the feeding-stuffs subsidy is removed.
The Ministry of Food has paid considerably more for imported feeding barley than the maximum price fixed for home-grown feeding barley in the past.
One cannot assess the full effect of the Government's decision on the future of the whole barley market, but some adjustment of prices will almost certainly occur after, if not before, April 1st.”
"Brewer's Guardian 1953", 1953, February page 13.
Presumably the reason the ministry paid more than the maximum price when buying foreign barley was purely a matter of supply. More feeding barley was needed and they had to pay what they needed to. But I can’t imagine it pleased British farmers.
Time for a table. One showing the huge increase in UK barley production:
| UK barley production and imports 1939 - 1960 | ||||
| Year ended Dec. 31. | Acreage. | Production | Average Price per cwt. | Barley Imports |
| cwt. | s d | cwt. | ||
| 1939 | 1,013,000 | 17,840,000 | 8 10 | 13,740,000 |
| 1940 | 1,339,000 | 22,080,000 | 18 2 | 9,146,000 |
| 1941 | 1,475,000 | 22,880,000 | 24 0 | 1,277,000 |
| 1942 | 1,528,000 | 28,920,000 | 45 8 | 0 |
| 1943 | 1,786,000 | 32,900,000 | 31 5 | 0 |
| 1944 | 1,973,000 | 35,040,000 | 26 5 | 0 |
| 1945 | 2,215,000 | 42,160,000 | 24 5 | 2,037,000 |
| 1946 | 2,211,000 | 39,260,000 | 24 3 | 2,195,000 |
| 1947 | 2,060,000 | 32,380,000 | 24 0 | 2,257,000 |
| 1948 | 2,082,000 | 40,540,000 | 26 10 | 15,618,000 |
| 1949 | 2,060,000 | 42,580,000 | 25 10 | 9,223,000 |
| 1950 | 1,778,000 | 34,220,000 | 27 11 | 15,289,000 |
| 1951 | 1,908,000 | 38,780,000 | 38 10 | 24,270,000 |
| 1952 | 2,281,000 | 46,680,000 | 32 7 | 22,641,000 |
| 1953 | 2,226,000 | 50,420,000 | 30 1 | 28,702,000 |
| 1954 | 2,063,000 | 44,880,000 | 25 9 | 18,602,000 |
| 1955 | 2,295,000 | 58,720,000 | 26 0 | 18,554,000 |
| 1956 | 2,323,000 | 56,000,000 | 25 8 | 16,215,000 |
| 1957 | 2,622,000 | 59,140,000 | 23 2 | 20,168,000 |
| 1958 | 2,755,000 | 63,400,000 | 22 11 | 26,504,000 |
| 1959 | 3,057,000 | 80,320,000 | 22 7 | 19,939,000 |
| 1960 | 3,372,000 | 84,820,000 | 21 3 | 14,083,000 |
| Source: | ||||
| 1971 Brewers' Almanack, page 61. | ||||
UK barley production and imports 1939 - 1960
In England, both supplies and demand were good:
“Since the New Year supplies in Mark Lane and the provincial markets of English malting samples remained of good volume with a definite demand for the finest types of grain as well as those for purposes other than malting.”
"Brewer's Guardian 1953", 1953, February page 13.
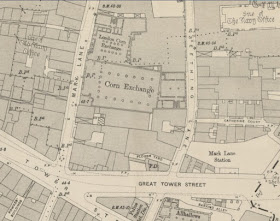
Mark Lane, in case you were wondering, was the location of the Corn Exchange in the City of London. It seems to have been an important spot for trading all sorts of grains:
"The Corn Exchange, Mark Lane, was erected in 1828 from designs by Mr. Smith, at an expense of 90,000l., and is a very fine specimen of time Greek Doric style of architecture. The wholesale corn trade of the city of London is entirely conducted here; and oats, beans, and all other kinds of grain are sold by sample in this market, which is held three times a week - viz. Mondays, Wednesdays, and Fridays; but by far the best attendance is on Mondays."
Mogg's New Picture of London and Visitor's Guide to its Sights, 1844
It sounds a lovely building. Sadly, it’s been replaced by a crappy office block, which bears the name Corn Exchange but is nothing of the sort. Here’s a map from the 1890’s showing where it stood (very close to the Tower of London):
Next time we’ll be looking at prices in the various districts of the UK.


In 1939, the sum of grown and imported barley was around 30 million cwt.
ReplyDeleteBy 1945 it was over 40 million cwt.
That's a big increase in barley use.
That wouldn't have anything to do with the need to provision the entire Allied Expeditionary Force would it?
Delete